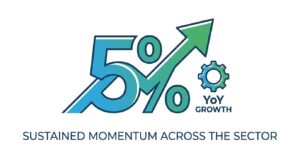
A growth rate exceeding five per cent year on year has emerged as a defining marker for the sector, underscoring a trajectory that few analysts had confidently predicted twelve months ago. While headline figures often obscure the mechanics beneath them, this particular uptick carries weight: it reflects not a one-off spike but a pattern of compounding gains that stakeholders across the value chain are now positioning around. The question that lingers, arguably, is whether this pace can hold through the headwinds gathering on the horizon.
What a Five Per Cent Expansion Actually Tells Us
Before unpacking the strategic implications, it helps to frame what this growth figure represents in practical terms. A five per cent year-on-year increase, sustained across consecutive reporting periods, typically signals that underlying demand drivers are structural rather than cyclical. That distinction matters for capital allocation, workforce planning, and competitive positioning alike.
- Revenue expansion at this rate compounds meaningfully over a three-to-five-year window, potentially adding double-digit cumulative gains without requiring aggressive market share grabs
- Operational margins tend to benefit from volume-driven efficiencies when growth is organic rather than acquisition-fuelled
- Investor confidence in the sector has shifted from speculative to conviction-grade, with institutional flows reflecting longer holding periods
- Hiring patterns across the industry suggest firms are building capacity for sustained output, not temporary surges
- Supply chain partners are locking in longer-term contracts, a behavioural signal that downstream players trust the trajectory
The Drivers Behind Consistent Expansion
Growth rarely arrives without cause. In this case, several converging forces have created conditions that favour continued expansion. Consumer demand has remained resilient despite inflationary pressures that squeezed discretionary spending in adjacent categories. And while pricing power has played a role, volume gains account for a meaningful share of the increase (a distinction regulators have been slow to interrogate).
Technology adoption has also accelerated internal efficiencies. Firms that invested in digital infrastructure during leaner years are now harvesting returns in the form of lower cost-per-unit economics and faster go-to-market cycles. That operational leverage shows up directly in the growth figures.
Regulatory tailwinds have helped too. Recent policy adjustments in several key markets have reduced compliance friction, enabling faster product launches and broader distribution. Not every market participant has benefited equally from these shifts, but the aggregate effect on sector-wide growth is measurable.
How This Growth Compares Across Peer Sectors
| Sector | YoY Growth Rate | Primary Growth Driver | Outlook |
|---|---|---|---|
| Subject Sector | 5%+ | Organic demand + operational leverage | Positive, with moderate risk factors |
| Adjacent Sector A | 2.8% | Price increases | Stable but volume-constrained |
| Adjacent Sector B | 4.1% | Geographic expansion | Positive, execution-dependent |
| Broader Market Average | 3.3% | Mixed | Cautiously optimistic given macro uncertainty and tightening monetary conditions that could slow credit-dependent segments |
The outperformance relative to the broader market average is notable. At five per cent, the sector is growing roughly 50 per cent faster than the composite benchmark. Still, context matters: some of the peer sectors face structural constraints that make direct comparison imperfect.
Strategic Framing: What Decision-Makers Should Weigh
Growth of this magnitude creates both opportunity and obligation. For executives, the temptation is to extrapolate forward and plan for continued acceleration. But history suggests that the most dangerous phase for any business is the one where confidence outpaces discipline.
Three strategic considerations deserve attention right now. First, capacity planning must account for the possibility that growth moderates to the three-to-four per cent range without triggering overcapacity. Second, talent acquisition strategies should prioritise retention mechanisms over aggressive hiring, since labour markets remain tight and onboarding costs erode margin gains. Third, firms should stress-test their supply chains against scenarios where input costs rise faster than pricing power allows.
Organisations that have built resilient corporate strategies around scenario planning tend to navigate these inflection points more effectively than those operating on a single baseline forecast.
The Behavioural Dimension: Why Perception Shapes Outcomes
Numbers tell one story. How stakeholders interpret those numbers tells another, often more consequential one. Neuro-linguistic programming principles offer a useful lens here: the way growth data is framed internally within organisations directly influences the quality of decisions that follow.
When leadership teams anchor on a five per cent figure as a floor rather than a ceiling, they unconsciously bias resource allocation toward expansion at the expense of resilience. This anchoring effect, well-documented in behavioural economics, can lead to overcommitment in capital expenditure cycles. Reframing the same data as “growth within a band of uncertainty” produces materially different planning outcomes.
Language matters in external communications too. Firms that describe their performance using sensory-rich, specific language tend to generate stronger stakeholder buy-in than those relying on abstract financial jargon. Saying “we added 12,000 new customers across three regions” lands differently than “we achieved robust top-line expansion.” The former creates a mental image. The latter creates nothing.
Equally important is the meta-model concept from NLP, which encourages leaders to challenge generalisations, deletions, and distortions in how information flows through an organisation. When a board hears “growth is strong,” the productive response is to ask: strong relative to what? Over what timeframe? In which segments? These clarifying questions prevent the kind of strategic drift that often follows periods of apparent success.
Even the representational systems people use to process information play a role. Visual thinkers respond to charts and dashboards. Auditory processors absorb narrative briefings more effectively. Kinesthetic decision-makers need to “feel” the momentum through site visits and operational immersion. Organisations that communicate growth data across multiple representational channels tend to align faster and execute with fewer internal friction points.
Frequently Asked Questions
What does five per cent year-on-year growth mean in practical terms?
It means the sector’s total output or revenue in the current period is more than five per cent higher than the same period one year earlier. Compounded over several years, this rate can translate into substantial cumulative expansion.
Is this growth rate sustainable?
Sustainability depends on whether the underlying drivers are structural or temporary. Current indicators suggest a mix of both, which means the rate could moderate but is unlikely to reverse sharply in the near term.
How should companies respond to this growth environment?
With calibrated ambition. Invest in capacity and talent, but stress-test plans against slower-growth scenarios. The firms that thrive in expansion phases are typically those that never fully trust the tailwind.