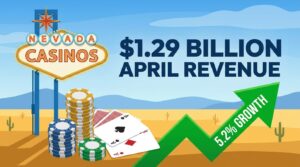
Nevada’s casino industry recorded $1.29 billion in gaming revenue during April 2025, reflecting a 5.2% increase compared to the $1.23 billion reported in the same month last year. The figures, released by the Nevada Gaming Control Board, signal continued resilience across the state’s gambling sector despite broader economic headwinds. Both the Las Vegas Strip and downtown Las Vegas contributed to the upward trajectory, though performance varied across market segments.
What April’s Revenue Figures Reveal About Nevada’s Gaming Trajectory
The gains weren’t uniform, and that unevenness tells a more interesting story than the topline number alone. Here are the strategic takeaways from the latest data:
- Statewide gaming revenue climbed to $1.29 billion, a 5.2% jump from April 2024’s $1.23 billion, extending a streak of year-over-year monthly gains
- The Las Vegas Strip remains the dominant revenue engine, though its share of total state revenue continues to face pressure from regional and digital competitors
- Table games and slots both contributed to the increase, with slot revenue maintaining its outsized role in overall win totals
- Downtown Las Vegas posted solid numbers, benefiting from a mix of tourism recovery and local foot traffic that has stabilized post-pandemic
- Nevada’s results stand in contrast to several other U.S. gaming jurisdictions where revenue growth has plateaued or turned negative in recent months
Strip Performance and the Tourism Factor
The Las Vegas Strip, which accounts for the largest concentration of gaming revenue in the state, continued to benefit from robust visitation numbers. Convention traffic, entertainment programming, and international tourism all played a role. Major operators along the corridor, including those managed under the MGM Resorts portfolio of properties on the Strip, have invested heavily in non-gaming amenities that drive foot traffic to casino floors.
Still, the revenue picture is more nuanced than a simple growth headline suggests. Average daily room rates on the Strip have softened slightly compared to their 2023 peaks, which could eventually filter through to gaming spend per visitor. Whether operators can sustain this revenue pace through the traditionally slower summer months remains an open question (a distinction worth watching as Q3 earnings season approaches).
How Nevada Compares to the Broader U.S. Market
Nevada’s 5.2% growth rate looks particularly strong when measured against the national landscape. Several commercial gaming states have reported flat or declining revenues in early 2025, driven by market saturation, increased competition from online gambling, and consumer spending shifts.
That divergence matters. Nevada’s model, built around destination tourism and high-value experiential spending, arguably insulates it from some of the pressures facing convenience-gaming markets in the Midwest and Mid-Atlantic. But it also makes the state more vulnerable to macroeconomic shocks that affect travel and discretionary spending. A slowdown in air travel bookings or a dip in consumer confidence could compress margins faster than in states where gaming revenue is driven by local, habitual play.
| Metric | April 2025 | April 2024 | Change |
|---|---|---|---|
| Statewide Gaming Revenue | $1.29 billion | $1.23 billion | +5.2% |
| Primary Revenue Driver | Las Vegas Strip | Las Vegas Strip | Consistent |
| National Context | Above-average growth | Moderate growth | Nevada outpacing several peer states |
The Psychology Behind Sustained Gaming Spend
Understanding why gaming revenue continues to grow in Nevada requires looking beyond the balance sheet. At its core, the Las Vegas experience is engineered around psychological engagement. Casinos deploy environmental design principles, from lighting and sound architecture to the spatial layout of gaming floors, that align closely with concepts found in neuro-linguistic programming and behavioral economics.
Anchoring effects play a visible role. When visitors encounter high-denomination table minimums or premium VIP experiences, their perception of “normal” spending recalibrates upward. This isn’t accidental. Operators have refined these techniques over decades, creating what behavioral scientists call a “frame” that encourages higher average wagers without overt pressure. The sensory environment of a Strip casino, carefully controlled temperature, absence of clocks, curated music playlists, works to sustain a state of engagement that extends session length.
Rapport-building between floor staff and high-value players mirrors NLP’s emphasis on mirroring and pacing. Casino hosts are trained to match the communication style and energy of their guests, fostering a sense of personal connection that increases loyalty and repeat visits. Reward programs amplify this by triggering dopamine-linked anticipation cycles: the promise of a complimentary room upgrade or a dinner reservation at a sought-after restaurant keeps the player emotionally invested in the property’s ecosystem.
Even the language used in marketing materials reflects these principles. Phrases like “your table is waiting” or “where luck finds you” employ presupposition, a linguistic pattern that assumes the desired outcome is already in motion. In practice, these micro-strategies compound across millions of visitor interactions each month, contributing to the kind of revenue durability Nevada has demonstrated.
What Comes Next for Nevada Gaming?
The summer months will test whether April’s momentum holds. Las Vegas typically sees a dip in visitation during the hottest weeks of the year, though major events, residency shows, and convention bookings have increasingly smoothed out seasonal volatility. Operators are also watching the regulatory environment closely; any expansion of legal sports betting in neighboring states could redirect some of the wagering activity that currently flows through Nevada’s sportsbooks.
And while $1.29 billion in a single month is a strong result by any measure, the industry’s cost structure has shifted. Labor costs are higher. Energy prices remain elevated. Construction and renovation spending across the Strip has accelerated. Revenue growth that doesn’t outpace cost inflation is, at least on paper, less impressive than it appears in a headline.
Frequently Asked Questions
How much gaming revenue did Nevada generate in April 2025?
Nevada casinos generated approximately $1.29 billion in gaming revenue during April 2025, representing a 5.2% increase over the $1.23 billion recorded in April 2024.
Which area of Nevada drives the most gaming revenue?
The Las Vegas Strip consistently produces the largest share of the state’s total gaming win, supported by tourism, conventions, and entertainment-driven visitation.
Is Nevada’s gaming growth in line with national trends?
Nevada is currently outperforming several other U.S. commercial gaming markets, many of which have seen flat or declining revenues in early 2025. The state’s tourism-driven model provides a degree of insulation from the saturation pressures affecting other jurisdictions, though it carries its own set of vulnerabilities tied to travel and consumer spending patterns.