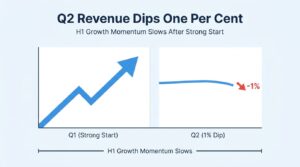
After a robust first quarter that propelled first-half revenue up 12 per cent, the company posted a one per cent decline in second-quarter revenue, signalling a notable deceleration in growth trajectory. The contrast between the two quarters raises questions about whether the momentum built earlier in the fiscal year can be sustained. While the H1 figure paints a broadly positive picture, the Q2 softening suggests headwinds that investors and analysts will want to dissect carefully.
What the Q2 Slowdown Tells Us About the Road Ahead
A single quarter rarely defines a company’s direction, but the shift from double-digit half-year growth to a marginal quarterly decline deserves scrutiny. Several factors could explain the gap between H1 strength and Q2 weakness, from seasonal demand patterns to macroeconomic pressures weighing on client spending. Here are the strategic takeaways worth watching:
- H1 revenue growth of 12 per cent indicates the underlying business retains structural demand drivers, even as short-term performance wobbles
- A one per cent Q2 revenue decline, while modest, breaks the growth streak and may reset market expectations for the second half
- The divergence between Q1 and Q2 performance suggests either front-loaded contract recognition or a deterioration in order flow mid-year
- Margin pressure and cost management will likely dominate the next earnings call, particularly if revenue growth fails to reaccelerate in Q3
- Competitive positioning matters more in flat-revenue quarters, where market share shifts become visible
H1 Performance in Context
Twelve per cent revenue growth across the first half of the year is, by most measures, a credible result. It outpaces inflation in most major economies and suggests the company has been winning business or expanding wallet share with existing clients. But strip out the Q1 contribution and the picture changes. The arithmetic is straightforward: if H1 grew 12 per cent and Q2 fell one per cent, then Q1 must have delivered substantially stronger performance, likely in the range of 25 per cent or higher depending on quarterly revenue weighting.
That kind of lopsided distribution raises a practical question. Was Q1 unusually strong, or is Q2 the beginning of a trend?
Why Quarterly Volatility Deserves a Closer Look
Revenue lumpiness is common in B2B sectors where large contracts, project-based billing, or seasonal procurement cycles dominate. Still, the swing from strong growth to slight contraction within a single half-year period is worth flagging. Companies that experience this pattern often face one of several dynamics:
| Scenario | Implication | Likelihood |
|---|---|---|
| Large contract recognised in Q1 | Revenue timing effect; underlying demand unchanged | Moderate to high |
| Client budget exhaustion mid-year | Potential H2 recovery as new budgets activate | Moderate |
| Competitive displacement | Structural risk requiring strategic response | Lower, but worth monitoring |
| Macroeconomic drag on discretionary spend | Broader sector issue, not company-specific — though the company’s exposure to cyclical verticals would amplify the effect | Moderate |
Without granular segment data, pinpointing the exact cause remains difficult. Management commentary in the coming weeks should clarify which of these dynamics is most relevant.
Reading Between the Numbers
One per cent is a small number. It sits right on the boundary between growth and contraction, the kind of figure that could swing either way with a single delayed invoice or a shifted project milestone. And yet markets tend to react to direction more than magnitude. A company that was growing and is now flat faces a different narrative than one that was flat and is now growing, even if the absolute numbers are identical.
This is where perception and reality diverge. The H1 result remains strong. The Q2 result is not alarming in isolation. But the trajectory shift creates a communication challenge for leadership, one that requires precision rather than optimism in forward guidance.
Strategic Framing: How Companies Navigate Deceleration Signals
When growth decelerates, the instinct for many organisations is to double down on messaging about long-term strategy and pipeline strength. That approach works, but only when supported by specifics. Executives who anchor their narrative in verifiable metrics (a distinction regulators and institutional investors increasingly demand) tend to maintain credibility through soft patches more effectively than those who lean on generalised confidence.
From a corporate strategy and financial planning perspective, the playbook during periods of revenue flattening typically involves three moves: accelerating cost discipline without cutting into growth-enabling functions, sharpening commercial focus on highest-probability pipeline opportunities, and increasing transparency with stakeholders about what’s changed and what hasn’t. The companies that handle these transitions well tend to share a common trait: they acknowledge the data without catastrophising it.
Arguably, the most important signal will come not from the revenue line itself but from order intake and backlog data. If the pipeline remains healthy, Q2 may prove to be a pause rather than a pivot. If pipeline metrics have also softened, the conversation shifts materially.
Frequently Asked Questions
How significant is a one per cent quarterly revenue decline?
In isolation, it’s marginal. The significance depends on context: whether it reflects timing effects, structural demand shifts, or broader economic headwinds. Direction matters more than magnitude at this scale.
Does the 12 per cent H1 growth offset the Q2 dip?
It provides a buffer, certainly. But investors and analysts will focus on the trend rather than the aggregate. A strong H1 built entirely on Q1 momentum is less reassuring than evenly distributed growth across both quarters.
What should stakeholders watch for next?
Three things: management’s explanation for the Q2 softness, forward guidance for H2, and any changes to capital allocation or cost management priorities. Order backlog data, if disclosed, will be the most telling indicator of whether this is a blip or the start of something more persistent.